Sunshine and humidity on tap for North Texans before rain returns
Thursday will be hot, humid and sunny across North Texas.
Watch CBS News
Breaking Local News, First Alert Weather & I-Team Reports
Thursday will be hot, humid and sunny across North Texas.
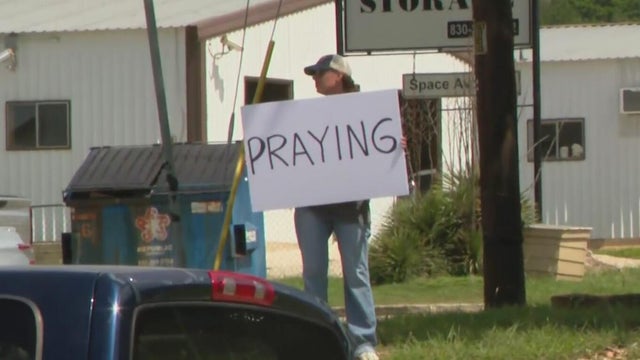
"I hope that everyone knows, prayers work and God is still out there," Kerrville resident Donna Ragsdale said.
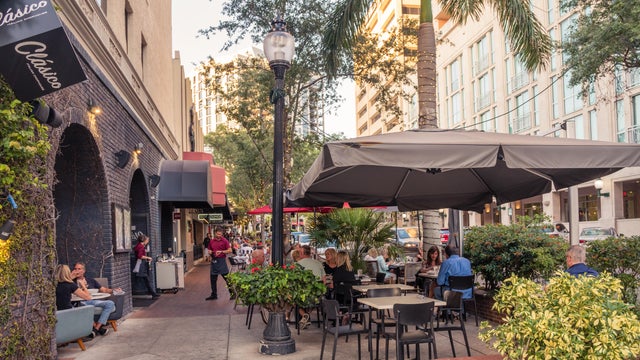
RentCafe.com study assessed the top U.S. cities for renters based on apartment quality, economic strength and other metrics.
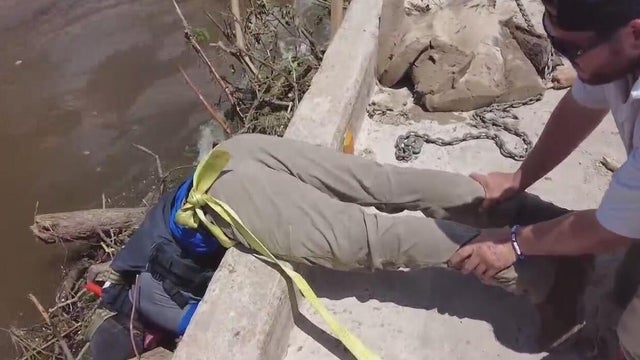
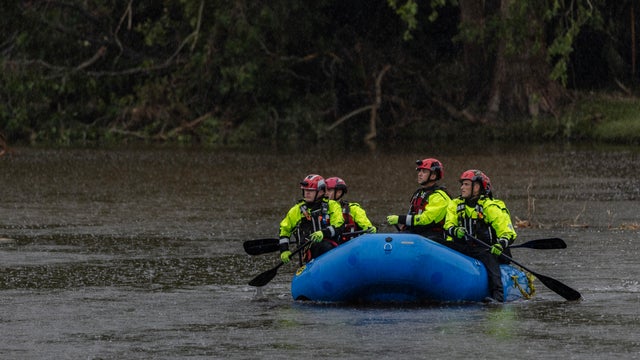
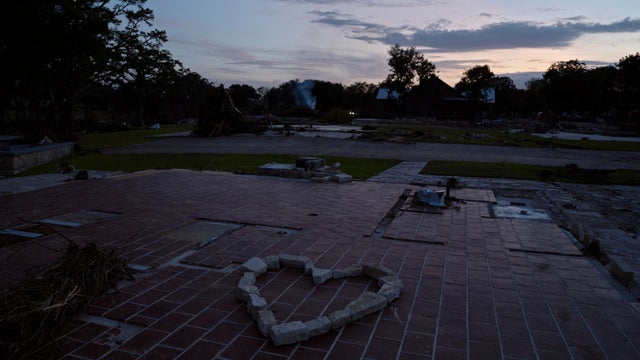
While there is not much that can be done at night because it's so dark, there are some people who are continuing the very slow, methodical process of untangling huge debris, where most of the remaining missing victims are believed to be.
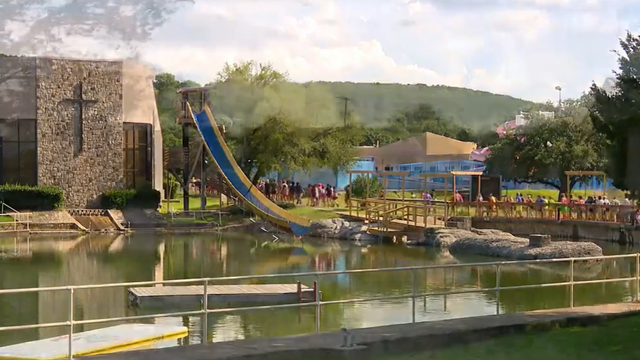
The camp had over two dozen emergency plans — but none for severe flooding until now.
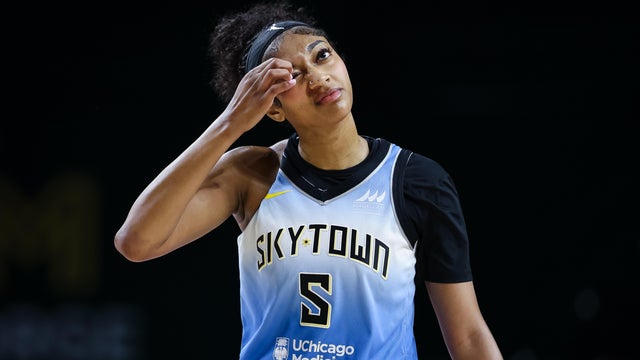
The Sky, who beat Dallas 97-92 on May 29 and 94-83 on May 31, swept the three-game regular-season series.
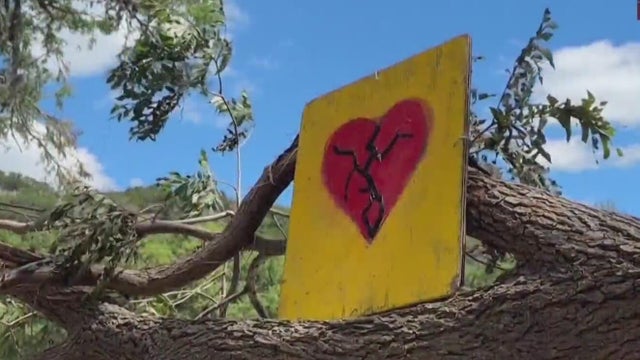
Through the heartbreak, this community is finding a way to help.
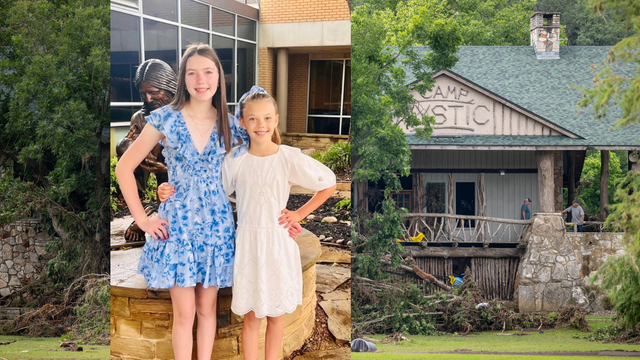
As the community mourns, the family is stepping forward to help — because they know this pain all too well.

Karmelo Anthony was indicted for murder by a Collin County grand jury in June.


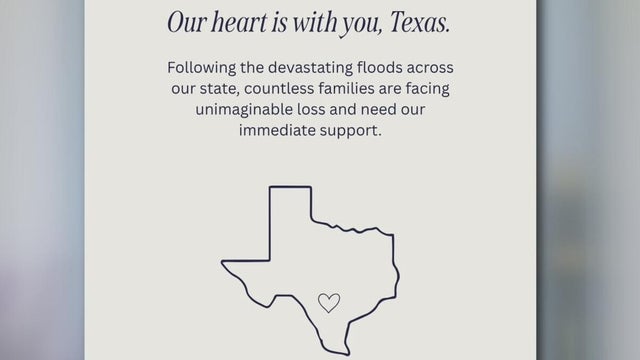
Several organizations are accepting donations for those impacted by the floods, as well as first responders and volunteers.
"I hope that everyone knows, prayers work and God is still out there," Kerrville resident Donna Ragsdale said.
While there is not much that can be done at night because it's so dark, there are some people who are continuing the very slow, methodical process of untangling huge debris, where most of the remaining missing victims are believed to be.
Through the heartbreak, this community is finding a way to help.
Texas Agriculture Commissioner Sid Miller dismissed conspiracy theories linking his agency to cloud seeding, saying it hasn't been involved in weather modification since 2011.
Records released Tuesday show Camp Mystic met state regulations for disaster procedures, but details of the plan remain unclear.
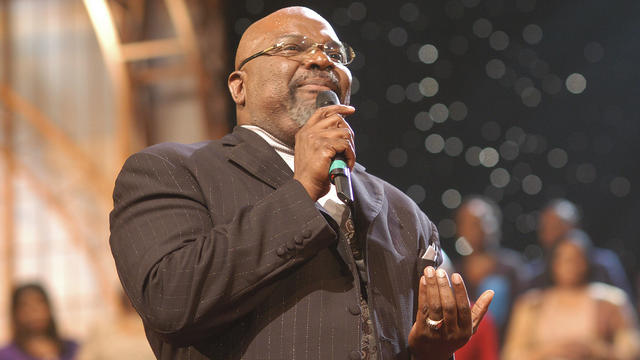
It's the end of one era, and the start of another at the Potter's House in Dallas.
Their deaths were confirmed Saturday by St. Rita Catholic Community church.
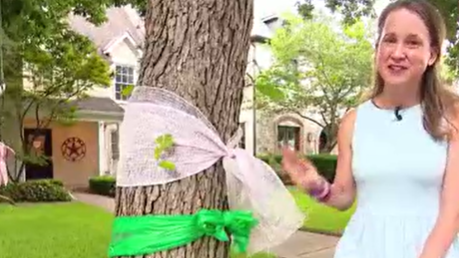
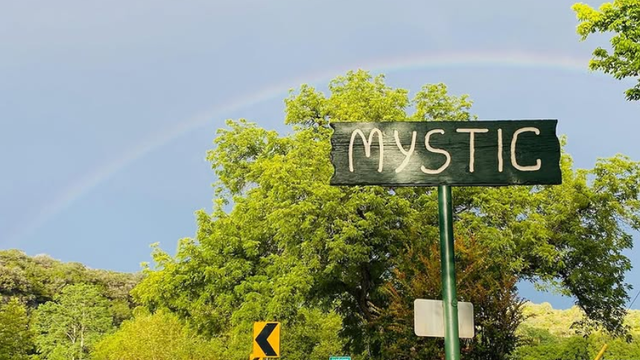
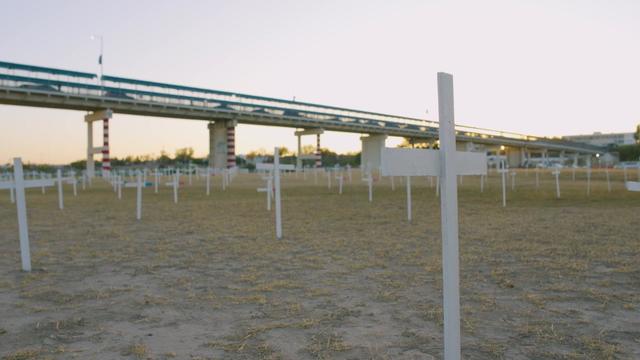
In Central Texas, from Hunt to Kerrville, residents are sharing signs of hope as the communities continue recovering from the deadly floods on July 4.
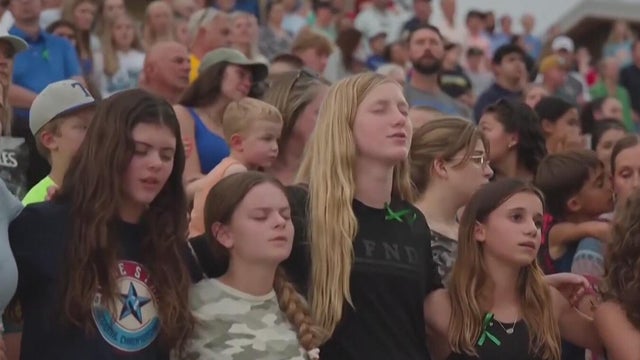
The Central Texas community held vigils and set up memorials to remember the lives lost during the July 4 flood.
Across Dallas-Fort Worth, you can donate items needed for Central Texas flood recovery.
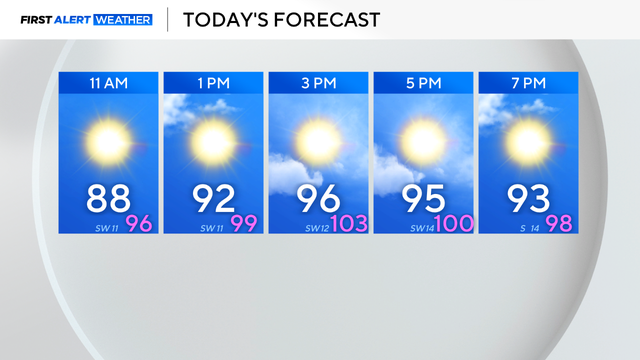
Thursday will be mostly sunny with highs near 100 degrees across Dallas-Fort Worth.
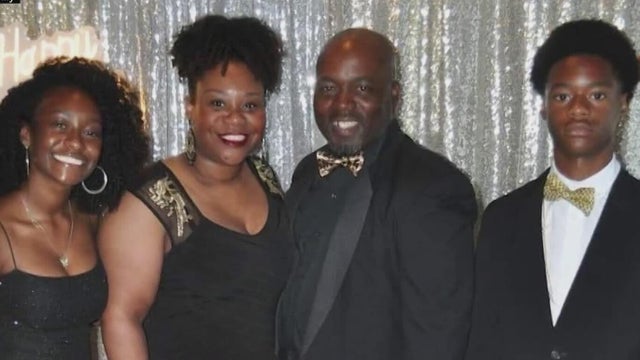
Family and community members are gathering on Thursday to honor and remember the people who were killed in the deadly 1-20 pileup crash on July 1 in Terrell.
Thursday will be hot, humid and sunny across North Texas.
Thursday will be mostly sunny with highs near 100 degrees across Dallas-Fort Worth.
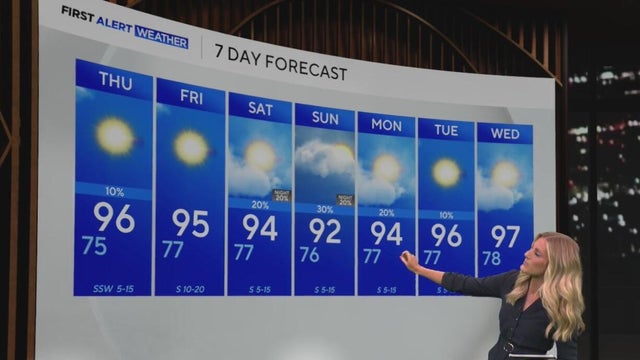
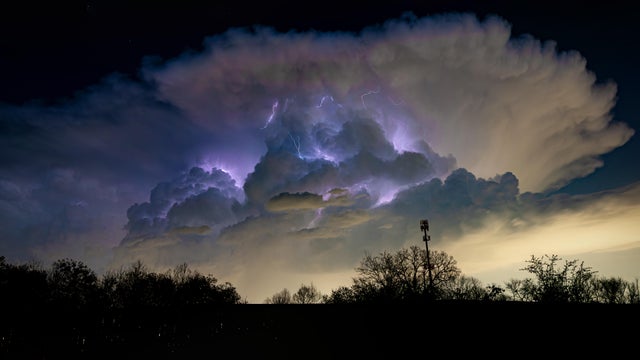
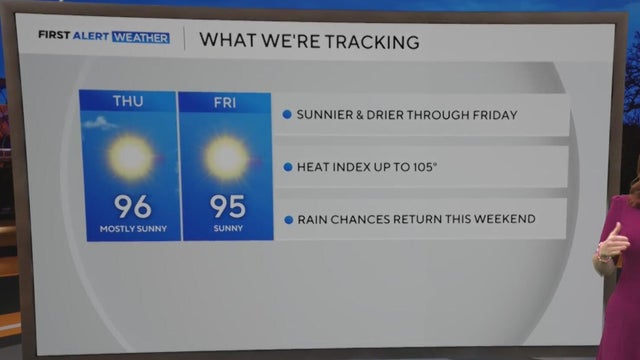
We've dealt with a couple of strong afternoon/evening thunderstorms across North Texas the last couple of days, as an upper-level trough moved across the region. By Thursday, high pressure starts to build back in, leading to warmer temperatures, and drier conditions, albeit humid.
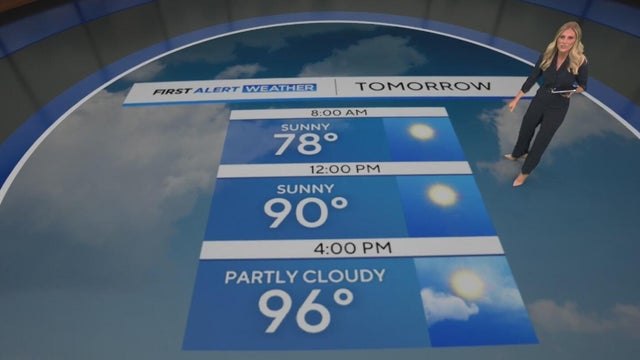
Temperatures return to average in the mid-90s to end the work week with feels-like temperatures to 105.

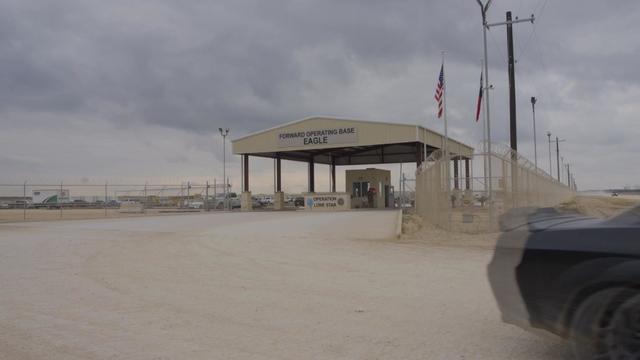
Two weeks ago, the Trump administration began carrying out its latest tactic aimed at fast-tracking deportations.

The detentions come on the heels of similar arrests earlier this week in immigration courts across the country.
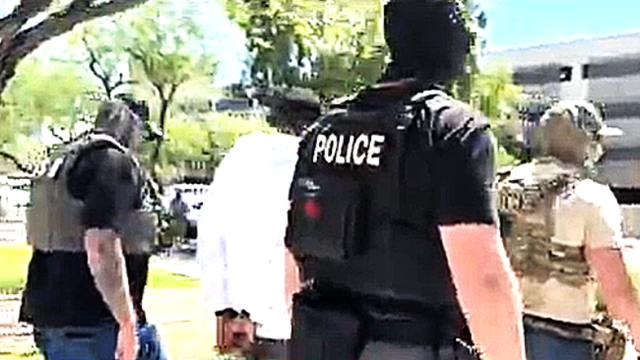
Multiple sources have confirmed that at least a handful of people were arrested on the spot after their cases were dismissed in Dallas.

While illegal migrant crossings have dropped, immigration courts now have a historically high volume of cases

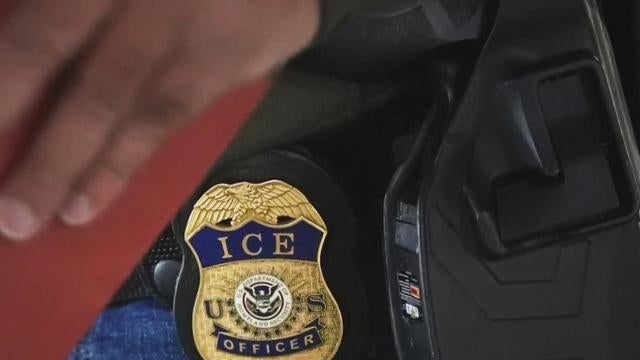
With the expansion of the 287(g) program, local and state officers will be able to enforce some immigration duties.
While the Trump administration says they're only targeting criminals for deportation, those words have done little to comfort some immigrants
A few weeks into his second term, President Donald Trump has issued dozens of executive orders.
Two faith leaders view border politics through different lenses.
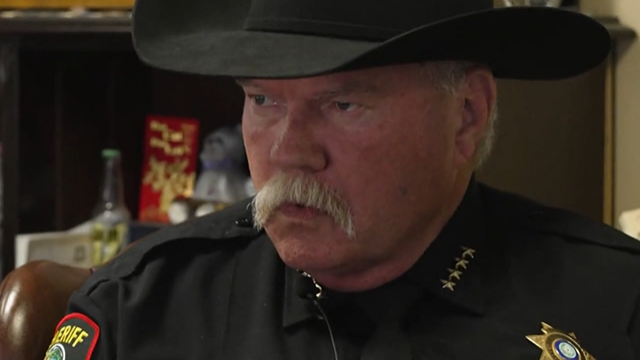
Many Texas law enforcement officials say they are feeling positive as Donald Trump re-enters the White House for a second term.
The Sky, who beat Dallas 97-92 on May 29 and 94-83 on May 31, swept the three-game regular-season series.
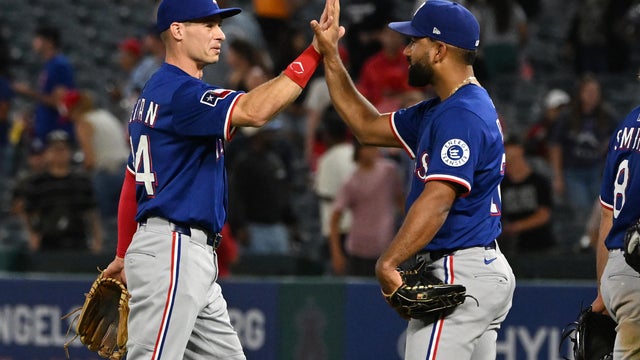
Nathan Eovaldi allowed one unearned run in six innings, Jake Burger and Wyatt Langford each homered and drove in four runs, and the Texas Rangers blew out the Los Angeles Angels 13-1 on Tuesday night.

Hopefully, we'll get to enjoy the much-anticipated Paige Bueckers and Caitlin Clark matchup this time around.

Despite the loss, rookie JJ Quinerly had a career-high 18 points and a career-best four made threes during the game.
"Amid so much sorrow, we are inspired by the strength of the Texas community as it comes together during this incredibly difficult time," the group said.
Eat See Play: Sponsored by Metroplex Cadillac Dealers

Eat See Play: Sponsored by Metroplex Cadillac Dealers

Eat See Play: Sponsored by Metroplex Cadillac Dealers

Eat See Play: Sponsored by Metroplex Cadillac Dealers

Eat See Play: Sponsored by Metroplex Cadillac Dealers
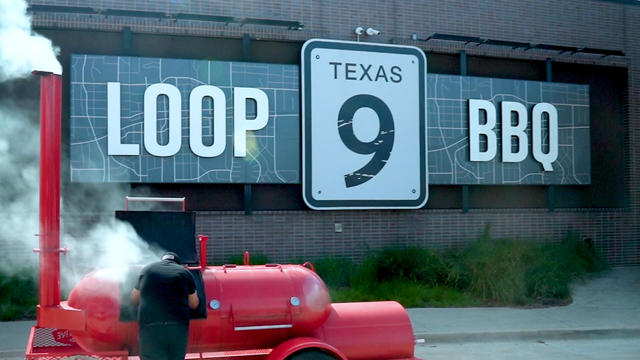
Texas does BBQ best so we took the Cadillac to Loop 9. Don’t miss out on all the traditional favorites and some with a twist. Eat See Play is sponsored by Metroplex Cadillac Dealers.

When that fine dining craving hits, jump in the Cadillac and head to The Landmark Prime Rib. Let your dinner take center stage as your meal is prepared in their vintage dining cart. Eat See Play is sponsored by Metroplex Cadillac Dealers.

Ready to get your golf on? Throw your clubs in the Cadillac and head to Tiger Woods's new putt-putt playground, Popstroke. Eat See Play is sponsored by Metroplex Cadillac Dealers.

Which hue looks best on you? We took the Cadillac to the Color Analysis Queen to see which shades make us shine. Eat See Play is sponsored by Metroplex Cadillac Dealers.
Thursday will be hot, humid and sunny across North Texas.
"I hope that everyone knows, prayers work and God is still out there," Kerrville resident Donna Ragsdale said.
RentCafe.com study assessed the top U.S. cities for renters based on apartment quality, economic strength and other metrics.
While there is not much that can be done at night because it's so dark, there are some people who are continuing the very slow, methodical process of untangling huge debris, where most of the remaining missing victims are believed to be.
The camp had over two dozen emergency plans — but none for severe flooding until now.
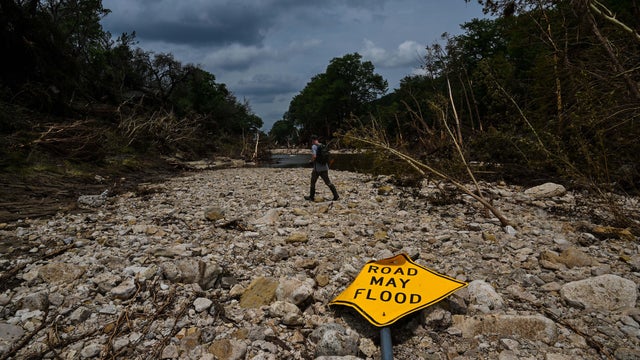
In what experts call "Flash Flood Alley," the terrain reacts quickly to rainfall steep slopes, rocky ground, and narrow riverbeds leave little time for warning.
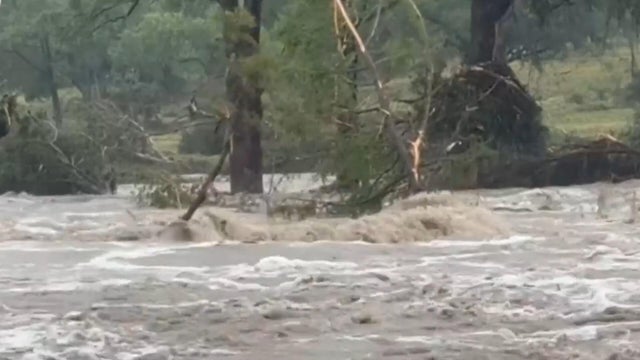
For days before catastrophic floods left parts of Central Texas inundated, the National Weather Service was tracking the chance of rain.
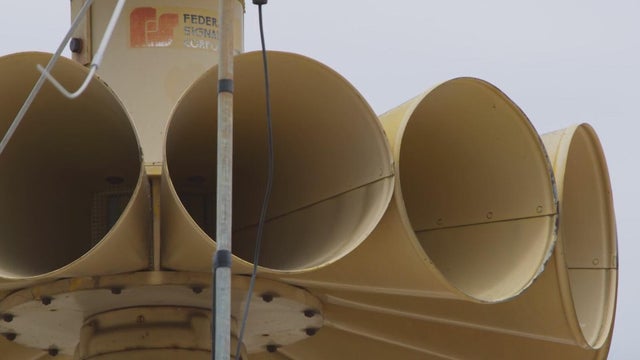
Lt. Gov. Dan Patrick told CBS News Monday that the state of Texas could pay for storm sirens along the Guadalupe River.
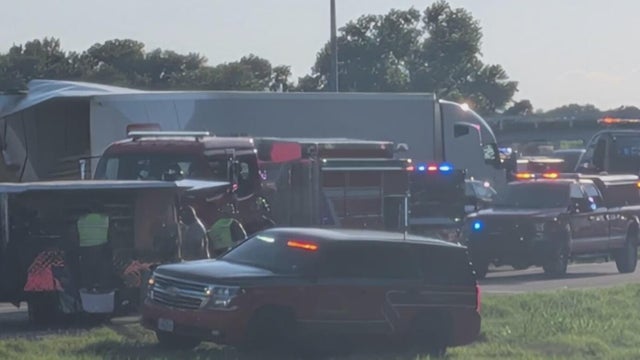
Federal investigators are examining the role driver fatigue may have played in a deadly I-20 crash near Terrell over the weekend.
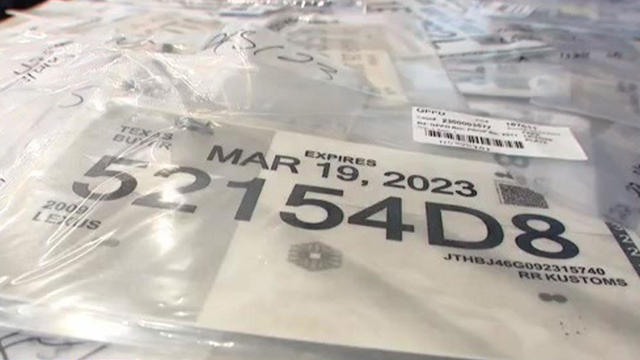
All temporary paper tags should be gone from Texas roads by Sept. 1.
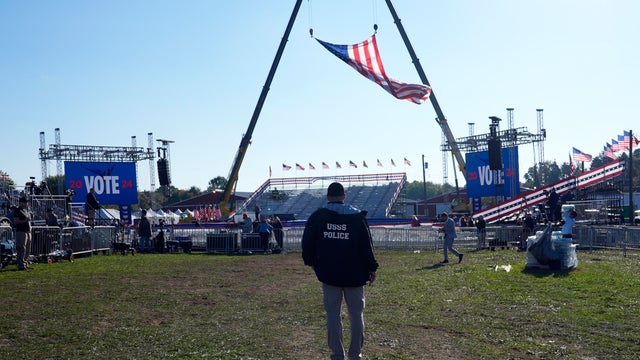
A top official defended the agency's decision not to fire anyone in connection with the July 13 assassination attempt.
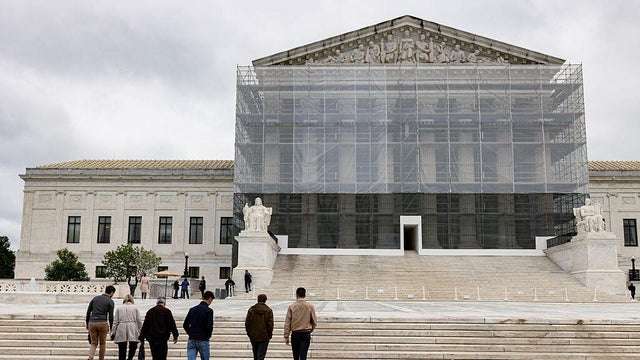
The Supreme Court on Tuesday lifted a lower court order that blocked sweeping layoffs of federal workers at nearly two dozen agencies.
Texas Republican State Rep. Jared Patterson and Democratic State Rep. Joe Moody have launched a bipartisan fundraising campaign with a goal of raising $150,000 to support affected families, first responders, and the broader community affected by the deadly flooding in Central Texas. Patterson discusses the tragedy’s impact and calls for improved emergency preparedness in future legislative sessions.

President Trump said Sunday that he would have gone to Texas immediately but he would be "in their way."

President Trump said the U.S. will impose steep levies on imports from 20 countries starting next month, raising pressure on trading partners.

At Fort Worth ISD's North Side High School, the sounds of an American sport on the field meet mariachi music in the stands.

With new foods, such as the "Drowning Taquitos" and the "Beso de Angel," Tony's Taco Shop owners say they don't take their success for granted.

Latinas in Tech DFW started back up last year after the pandemic. They have lots of opportunities for Latinas to network, connect, and learn new skills.
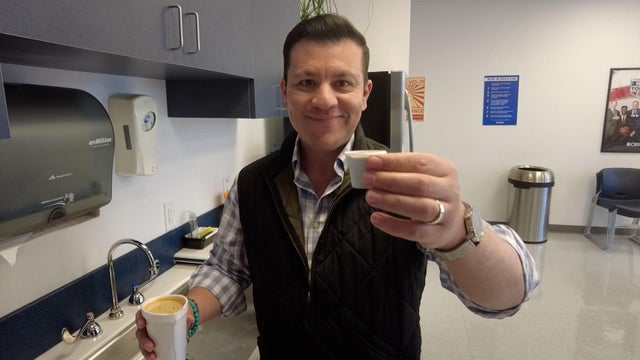
Anchor Ken Molestina shows us how he makes his Cuban coffee for the CBS News Texas newsroom.
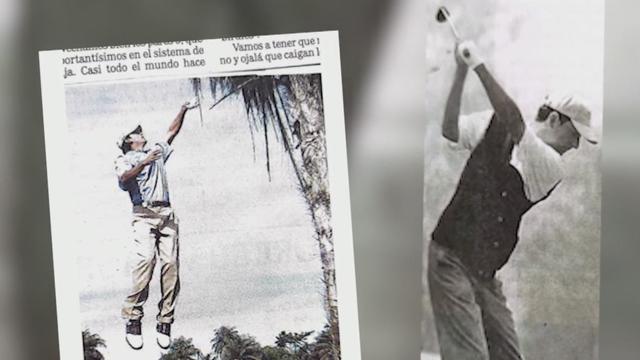
Del Olmo, who has played golf his entire life, recalls how rare the sport was for people like him growing up in Mexico City.
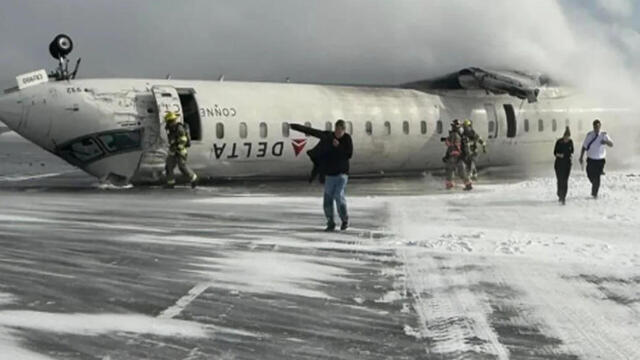
Less than two days after Delta Air Lines offered $30,000 to each passenger on board the flight that crashed and flipped in Toronto on Monday afternoon, the company is facing its first two lawsuits in the incident — and they likely won't be the last.
Texas Agricultural Commissioner Sid Miller is calling for a statewide ban on non-water additives, such as fluoride, in the public water system.
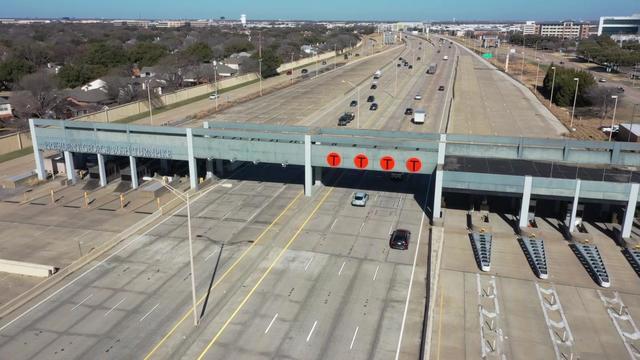
Last year, over 16 million vehicles drove on North Texas toll roads without paying, accumulating more than $69 million in unpaid tolls.
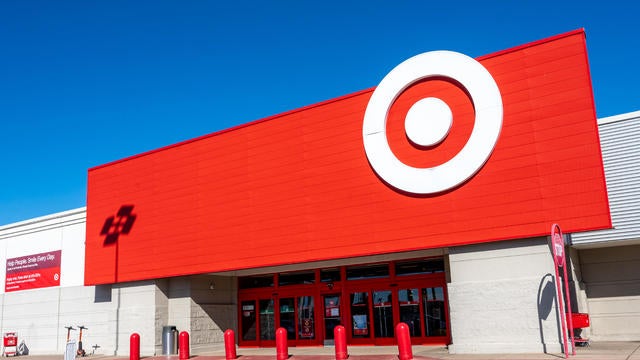
Activists are calling for a nationwide boycott of Target stores following the company's decision to roll back its diversity, equity and inclusion initiatives.

Discount store chain Target says it's joining rival Walmart and a number of other prominent American brands in scaling back corporate diversity, equity and inclusion initiatives.
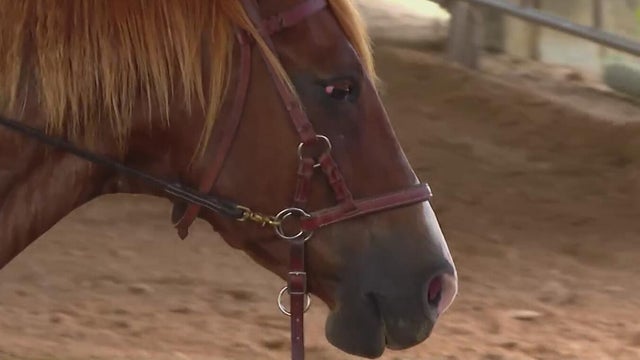
It's therapy that doesn't exactly look like therapy: outdoors, alongside a horse. Across North Texas, the demand for it is soaring.
Scientists conducting medical research are facing an existential crisis: Layoffs and budget cuts pushed by President Trump that, they say, jeopardize finding a cure for cancer.
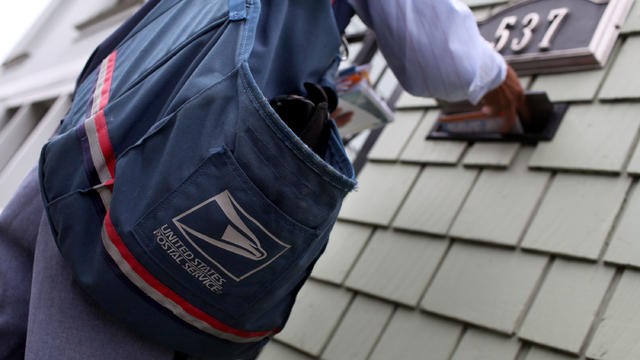
A Dallas mail carrier died Saturday after collapsing on his mail route on the first day of summer.

Pest control company Terminix used call data to determine which cities had the most bed bug-infested areas in the country.

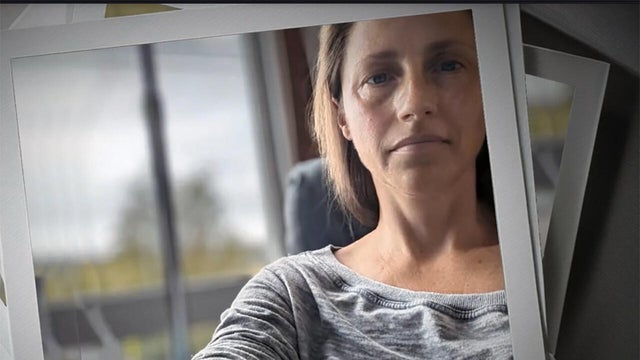
Just weeks away from prom and graduation, 18-year-old Katie Rangel started feeling off.
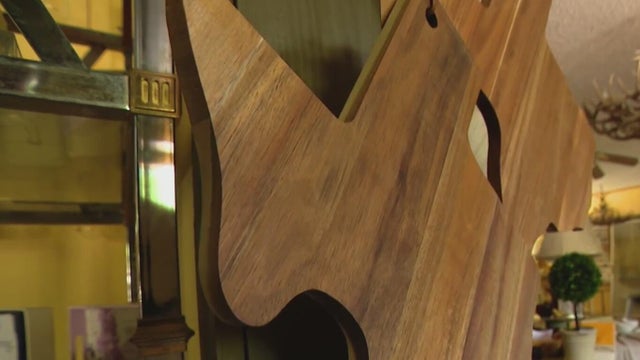
Located off the Guadalupe River in Historic Old Ingram Loop, the shop was once filled floor to with lighting, decor and trinkets.

They were already concerned about tariffs, but construction businesses in North Texas said they have new fears with the president's immigration crackdown.

The Texas Restaurant Association said 47% of Texas restaurant operators currently have job openings that are difficult to fill.
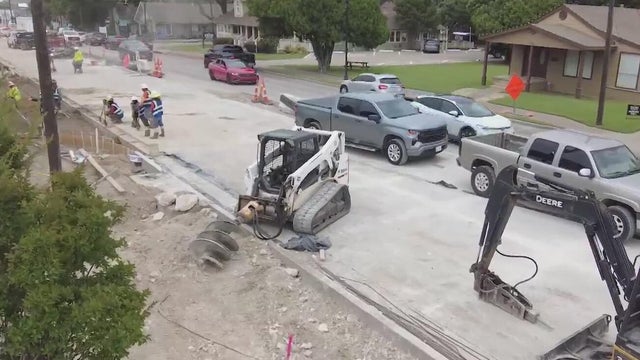
Plans to spruce up Frisco's historic downtown before next year's World Cup have business owners demanding help from the city to stay open.
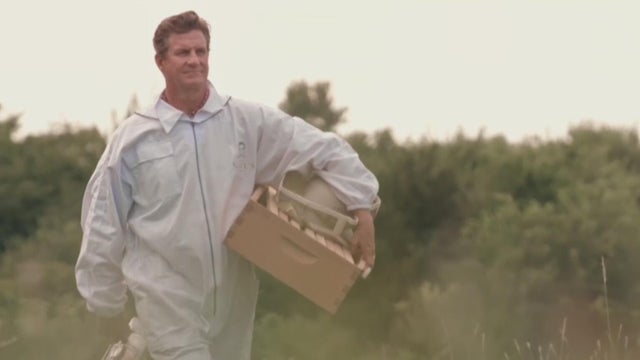
A North Texas man who has made a fortune off of honey is turning to politics to save the creatures that made him rich.
The Sky, who beat Dallas 97-92 on May 29 and 94-83 on May 31, swept the three-game regular-season series.
Nathan Eovaldi allowed one unearned run in six innings, Jake Burger and Wyatt Langford each homered and drove in four runs, and the Texas Rangers blew out the Los Angeles Angels 13-1 on Tuesday night.
Hopefully, we'll get to enjoy the much-anticipated Paige Bueckers and Caitlin Clark matchup this time around.
Despite the loss, rookie JJ Quinerly had a career-high 18 points and a career-best four made threes during the game.
"Amid so much sorrow, we are inspired by the strength of the Texas community as it comes together during this incredibly difficult time," the group said.

Sean "Diddy" Combs' lawyer says the music mogul got a standing ovation from fellow prisoners when he returned to the federal lockup in Brooklyn after the verdict.

Julian McMahon's last acting role before his death was playing the prime minister of Australia in Netflix's murder mystery series "The Residence."

Joey Chestnut is returning to the 2025 Nathan's Hot Dog Eating Contest. Here's how and when to watch.

Michael Madsen apparently went into cardiac arrest and was found unresponsive in his home in Malibu, California, on Thursday morning, according to his manager.

The multiplatform network owned by the once popular talk show host is facing financial struggles for which it finds its partner, Trinity Broadcasting Network, at fault.
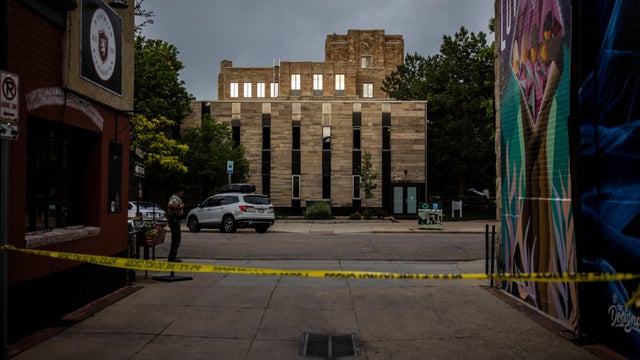
A suspect was taken into custody after an attack on Pearl Street Mall in Boulder on June 1 in which there were 15 people and a dog who were victims. The suspect threw Molotov cocktails that burned some of the victims, who were part of a march for Israeli hostages.

The Neonatal Intensive Care Unit babies at Texas Health locations across North Texas celebrated Valentine's Day.

As Anthony Davis prepared for his debut game at the AAC, Dallas Mavericks fans took to the arena to protest the controversial trade.

CBS News Texas viewers got out and enjoyed the snow day on Thursday and send us all of their best photos. Take a look.
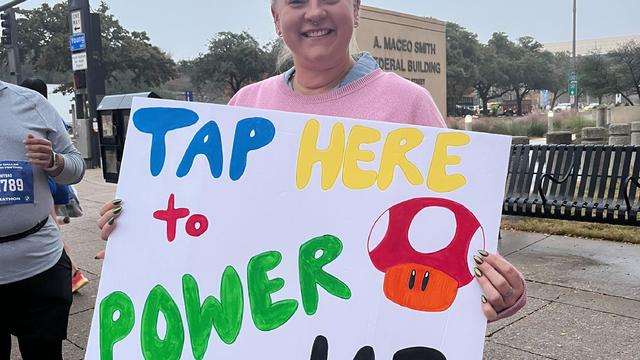
CBS News Texas captured the excitement and energy of the BMW Dallas Marathon Festival through photos.